


Lowcountry Real Estate Report | October 23–30, 2026
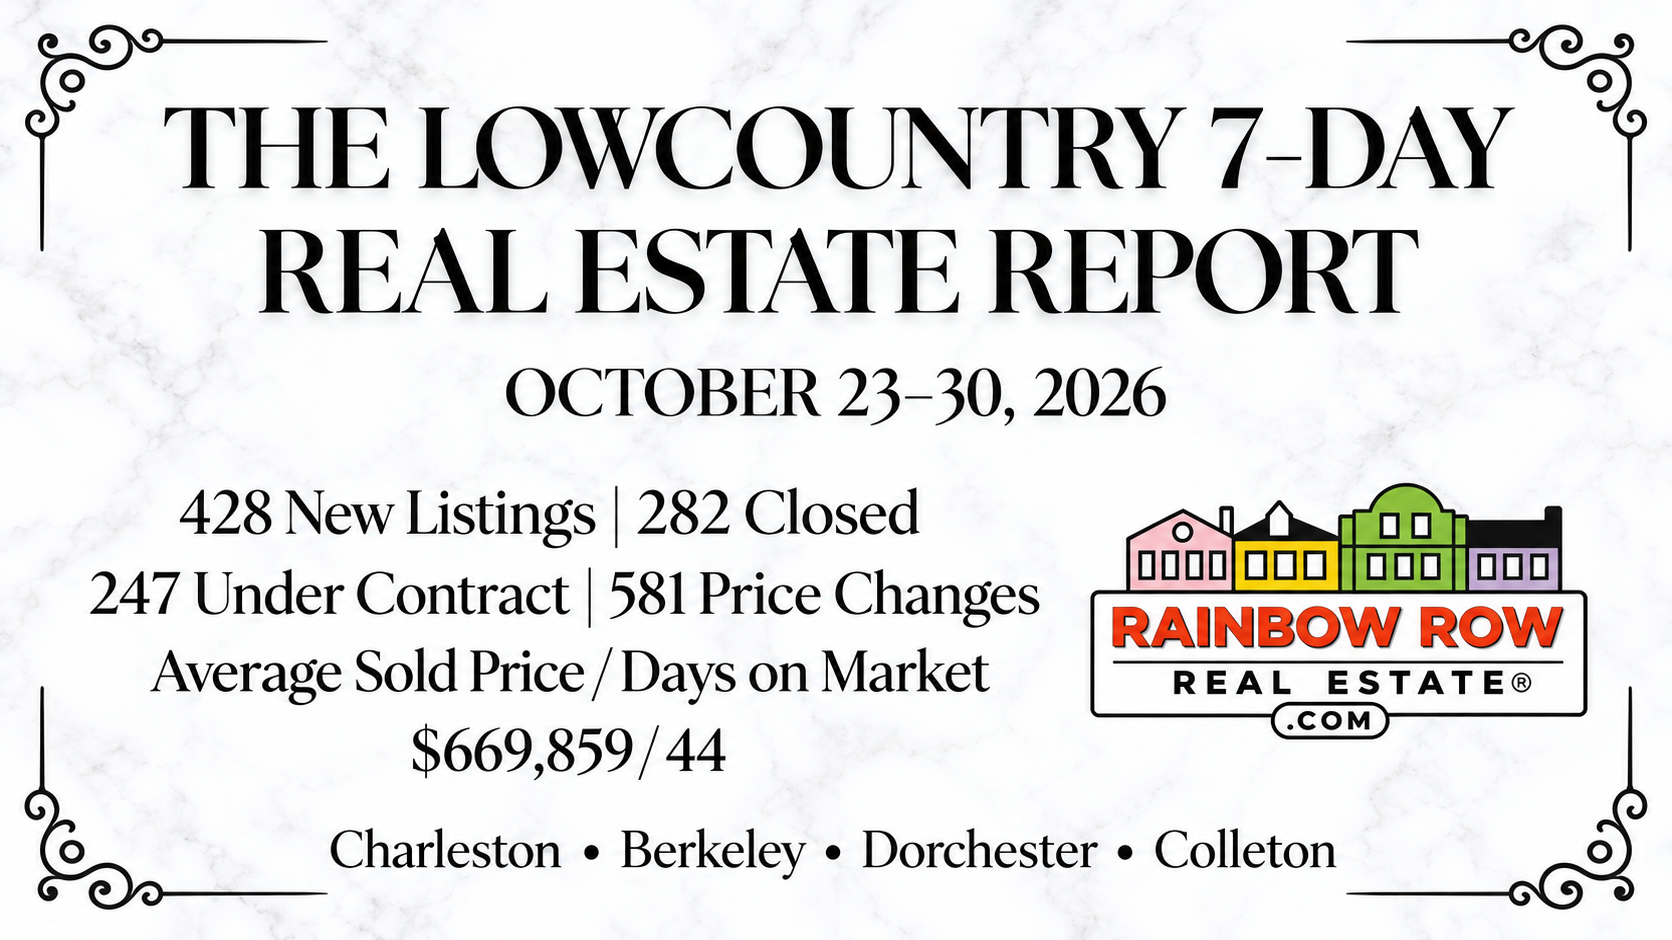
Closings accelerated across the Lowcountry this week. From Charleston and Johns Island to Summerville, Ridgeville and Walterboro, 428 homes came on the market, 247 went under contract and 282 made it to the closing table.
The Quick Take
Closings rose sharply, contracts held steady and sold homes moved six days faster on average. Buyers are still active, but 581 price changes show that value and presentation continue to matter.
This Week’s Lowcountry Numbers
- 428 new listings — down 18 from last week
- 282 homes closed — up 65
- 247 homes went under contract — unchanged
- 581 price changes — down 43
- $669,859 average sold price — down $87,166
- 44 average days on market — down 6 days
Our Take
This was a stronger closing week. The 282 completed sales represented an increase of nearly 30% from the previous report, while 247 new contracts showed that buyers maintained the same pace for a second consecutive week. Fewer new listings arrived, so completed sales outnumbered new contracts and moved closer to the number of homes entering the market.
The average sold price moved from $757,025 to $669,859. That does not mean the value of a typical Lowcountry home fell by $87,166 in one week. Weekly averages can change substantially depending on which properties close. This week’s closing activity leaned heavily toward the Summerville and Ladson areas, while a different number of luxury closings can also move the regional average quickly.
Average days on market improved from 50 days to 44. That figure only covers homes that sold, but it is still encouraging: this week’s successful listings reached the closing table after spending about six fewer days on the market on average.
Where Were the Most Closings?
- Summerville/Ladson, Berkeley County — 52 closings
- Summerville/Ridgeville — 36 closings
- Johns Island — 20 closings
County-by-County Breakdown
Charleston County
174 new listings
117 homes closed
102 went under contract
211 price changes
Berkeley County
158 new listings
92 homes closed
84 went under contract
212 price changes
Dorchester County
86 new listings
64 homes closed
53 went under contract
145 price changes
Colleton County
10 new listings
9 homes closed
8 went under contract
13 price changes
What This Means for Buyers and Sellers
For buyers: Buyers are still successfully putting homes under contract, but the decline in new listings means the best choices may not sit around. Being prepared does not require rushing—it means knowing your budget, having financing ready and recognizing when the right home is priced fairly.
For sellers: The stronger closing total and shorter average marketing time are encouraging, but 581 price changes remain a reminder that buyers are comparing value carefully. A home that enters the market aligned with current competition has a better chance of becoming one of next month’s closings.
Source: Charleston Regional MLS/FlexMLS. Residential properties for sale only; rentals excluded. Data covers October 23–30, 2026, through 9:00 a.m. Eastern. Week-over-week figures compare with the previously published seven-day report. Statistics are market snapshots and are not an appraisal or a prediction of future value.