


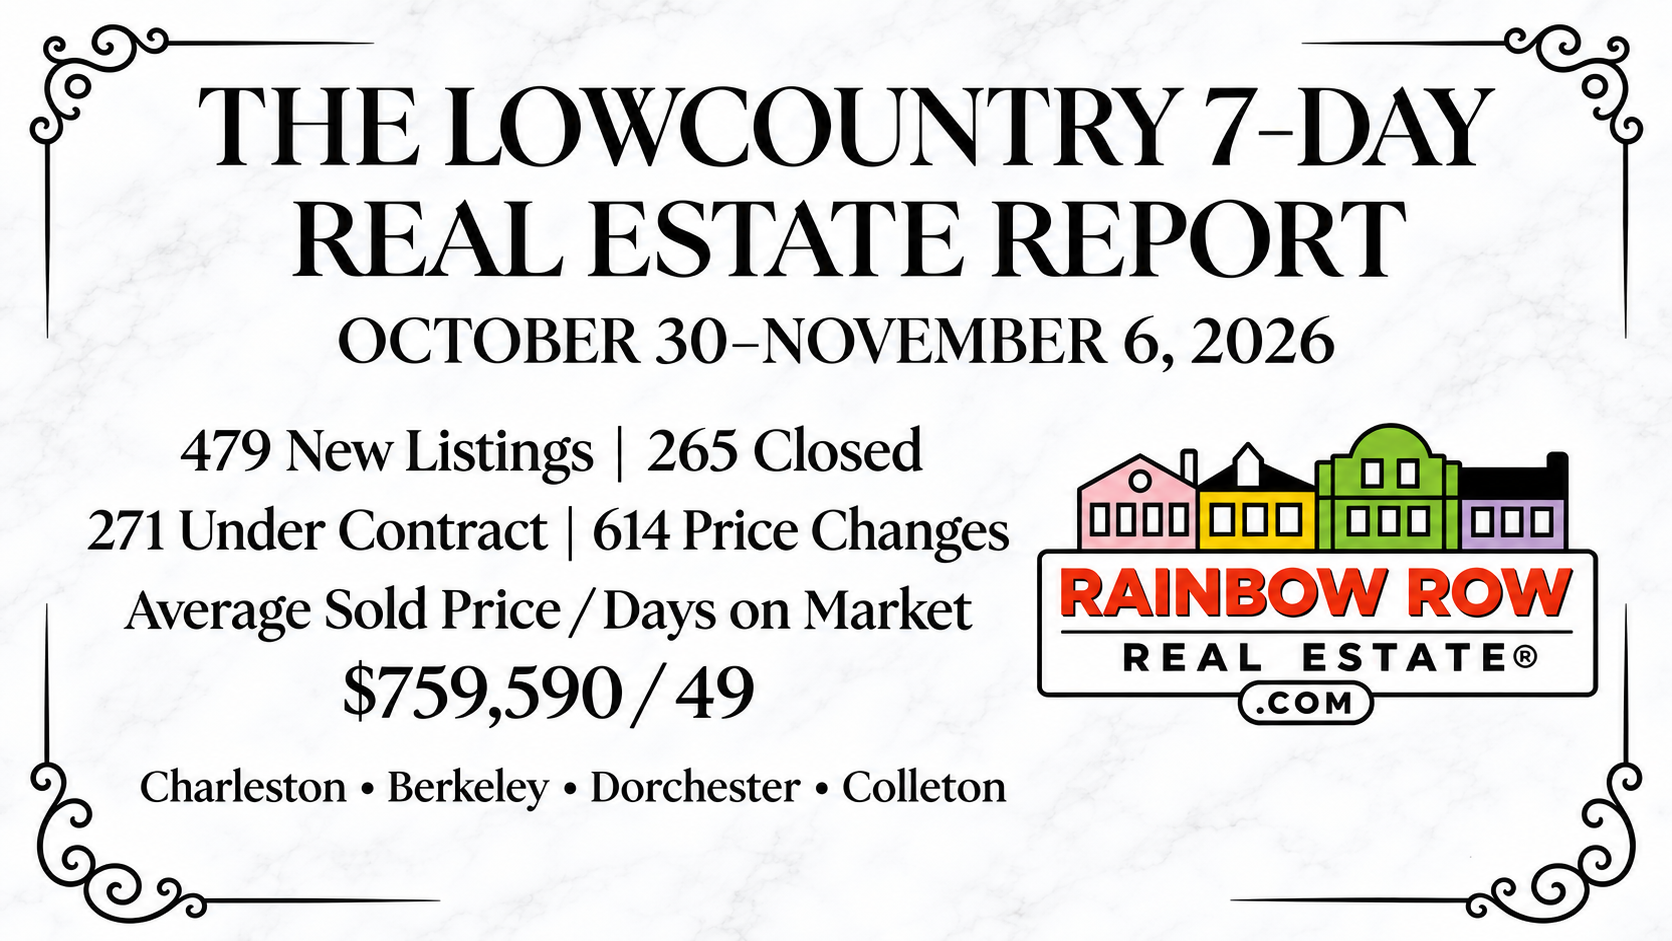
Lowcountry Real Estate Report | October 30–November 6, 2026
More homes entered the Lowcountry market this week, and buyer activity increased with them. Across Charleston, Berkeley, Dorchester and Colleton counties, 479 homes came on the market, 271 went under contract and 265 made it to the closing table.
The Quick Take
New listings and contracts both increased, giving buyers more choices without slowing buyer activity. Sellers are still adjusting, however, with 614 price changes recorded during the week.
This Week’s Lowcountry Numbers
- 479 new listings — up 51 from last week
- 265 homes closed — down 17
- 271 homes went under contract — up 24
- 614 price changes — up 33
- $759,590 average sold price — up $89,731
- 49 average days on market — up 5 days
Our Take
This was a busier week for both new inventory and buyer activity. The market added 479 new listings—51 more than the previous week—while 271 homes went under contract, an increase of 24. Closings eased from 282 to 265, but that still represents a substantial number of completed transactions across the four-county area.
Price changes increased to 614. That does not mean every one of those homes received a price reduction, but it shows how actively sellers and listing agents are responding to competition, buyer feedback and current affordability.
The average sold price rose from $669,859 to $759,590. That does not mean the value of the typical Lowcountry home increased by nearly $90,000 in one week. Weekly averages can move substantially depending on the mix of homes that close, particularly when the number of higher-priced coastal and Charleston-area sales changes.
Average days on market increased from 44 to 49 days. That figure only includes homes that sold, but it reinforces the same lesson we continue to see: buyers are active, although pricing and presentation still matter.
Where Were the Most Closings?
- Summerville/Ladson, Berkeley County — 35 closings
- Summerville/Ridgeville — 24 closings
- North Charleston/Summerville/Ladson outside I-526 — 22 closings
County-by-County Breakdown
Charleston County
232 new listings
137 homes closed
110 went under contract
221 price changes
Berkeley County
143 new listings
84 homes closed
82 went under contract
234 price changes
Dorchester County
86 new listings
38 homes closed
73 went under contract
144 price changes
Colleton County
18 new listings
6 homes closed
6 went under contract
15 price changes
What This Means for Buyers and Sellers
For buyers: More listings created additional choices this week, but the increase in contracts shows that other buyers are still moving when the home and price make sense. Preparation gives you time to evaluate a home properly without starting the financing conversation from scratch.
For sellers: Buyer activity increased, but so did price changes. A home entering the market needs to compete on condition, presentation and price from the beginning. Buyers are present; they are simply paying close attention to value.
Source: Charleston Regional MLS/FlexMLS. Residential properties for sale only; rentals excluded. Data covers October 30–November 6, 2026, through 9:00 a.m. Eastern. Week-over-week figures compare with the previously published seven-day report. Statistics are market snapshots and are not an appraisal or a prediction of future value.